utility functions
Utils
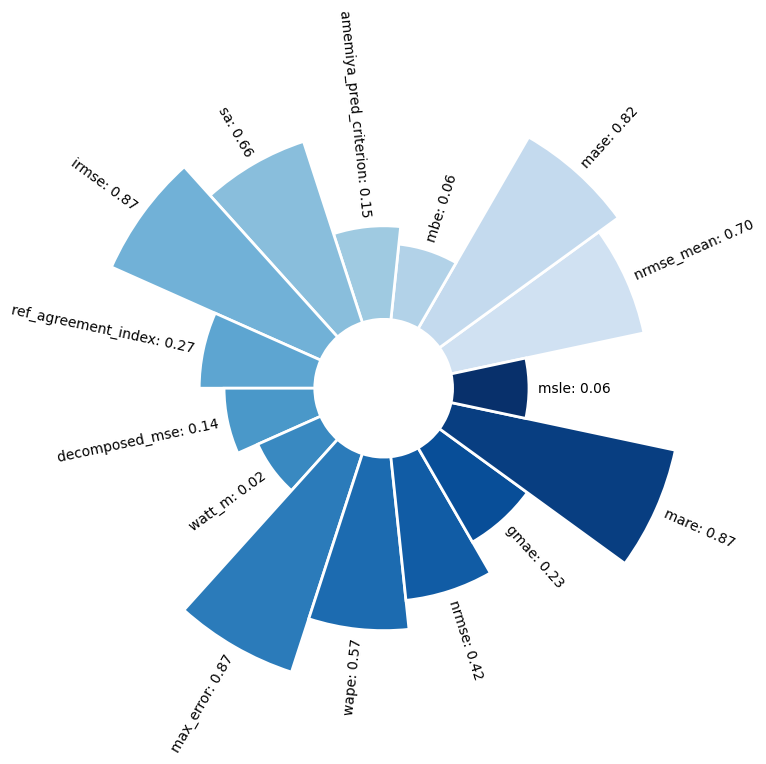
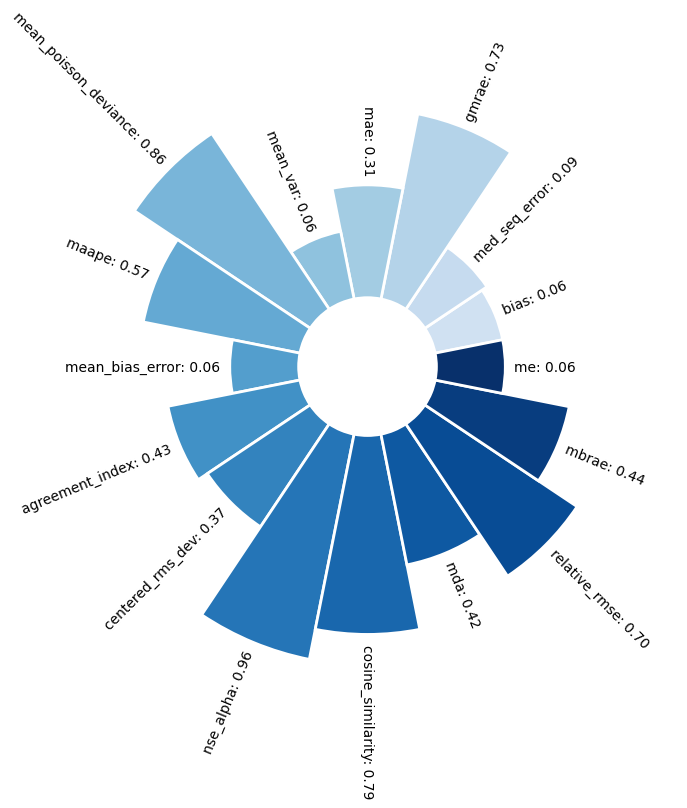
- class SeqMetrics.utils.plot_metrics(metrics: dict, ranges: tuple = ((0.0, 1.0), (1.0, 10), (10, 1000)), exclude: list | None = None, plot_type: str = 'bar', max_metrics_per_fig: int = 15, show: bool = True, save: bool = False, save_path: str = '', **kwargs)[source]
Plots the metrics given as dictionary as radial or bar plot between specified ranges.
- Parameters:
metrics – dictionary whose keys are names are erros and values are error values.
ranges – tuple of tuples defining range of errors to plot in one plot
exclude – List of metrics to be excluded from plotting.
max_metrics_per_fig – maximum number of metrics to show in one figure.
plot_type – either of
radialorbar.show – If, then figure will be shown/drawn
save – if True, the figure will be saved.
save_path – if given, the figure will the saved at this location.
kwargs – keyword arguments for plotting
Examples
>>> import numpy as np
>>> from SeqMetrics import RegressionMetrics
>>> from SeqMetrics import plot_metrics
>>> t = np.random.random((20, 1))
>>> p = np.random.random((20, 1))
>>> er = RegressionMetrics(t, p)
>>> all_errors = er.calculate_all()
>>> plot_metrics(all_errors, plot_type='bar', max_metrics_per_fig=50)
>>> # or draw the radial plot
>>> plot_metrics(all_errors, plot_type='radial', max_metrics_per_fig=50)